Egypt is a well-established country for having rich history including the Pyramids and early literacy culture. Now, Egypt has one of the highest number of population (100,800,000+ as of September 18, 2019) in Africa and this may mean that there would be potential social and economic strains as well as opportunities. Compared to the previous year, the population increased by 2% at about 1,960,000 people with 38,000 migrants included. About 43% of the population resides in an urban area and most of the whole population inhabits near the Nile River. The median age is stated to be 24.3 and the fertility rate at 3.43. 95% of the ethnicity is constituted of Egyptian, while the other 5% is composed of minority groups such as the Bedouins, Copts, Nubians, and Berbers. The official language spoken is Arabic, but English and French are also spoken. About 90% of the population are Muslims and the other 10% are Christians, mostly Coptic Orthodox. The weather in Egypt is mostly hot and dry with moderate winters. The country is formed in vast deserts with an average elevation at 321 meters. Many types of natural resources can be found in Egypt including petroleum, natural gas, natural elements such as iron, phosphates, manganese, lead, zinc and other rare earth elements. Land used for agriculture merely reaches about 4% (irrigated land of 36,500 square km) and even within this portion only 0.8% are permanently used. Although it seems counter-intuitive, there are forests in the Egyptian deserts; the sewage is filled with nutrients and acts as fertilisers for the growth of mahogany, eucalyptus, and sisal4. They cover about 0.1% of the whole Egypt. Common natural threats that occur are droughts, sandstorms, earthquakes, and flash floods with the last one considered the top nuisance. All this information was obtained from Reference 1, 2, and 3.
GDP (official exchange rate) was $236.53 and 249.56$ billion in 2017 and 2018, respectively, and it reached about $300 billion in 2019. GDP per capita was $2,495.02, $2,573.29, and $3,019.72 in 2017, 2018, and 2019, respectively. The average GDP growth experienced a spike from 2014 to 2015 (2.92% to 4.37%) and another spike from 2017 to 2018 (4.18% to 5.31%). During the time in between, the growth rate did not change significantly. The average growth rate is predicted to rise to about 6% by 2021 and is expected to be maintained until 2024. The average GDP is predicted to rise to $402.65 billion by 2024 with consistent increments every year from 2019. This indicates that GDP per capita will steadily increase as the years pass. The highest form of GDP came from the manufacturing sector at $9590 million. Additionally, the inflation rate in 2018 averaged at 20.86%, decreasing from 23.5% from the previous year. It is expected to steadily decrease over the next 5 years. The unemployment rate has been consistently about 11 – 12% for the past decade. The top export country of Egypt is the United Arab Emirates at around $2.69 billion and the top import country is China at around $8.07 billion. This was recorded in 2017. The most exported commodities were petroleum, gold, nitrogenous fertilisers, and insulated wire. The most imported commodities were wheat, iron, and also both refined and crude petroleum, although more capital was involved with export than with import. There was a trade deficit of $3.9 billion in 2019 and it seems likely that there will be a deficit for a long time, which introduces the government debt to the GDP that reached about 90%. Lastly, the last recorded Gini index of Egypt is 31.8 in 2015. More information can be found on Reference 5 and 6 e.g. GDP from agriculture or living wage.
The goal of a smart city project is to promote inclusiveness and sustainability while increasing the quality of the country/city’s economic and social status. As aforementioned in the first paragraph, Egypt is a quite homogenous country and it has great potential to further invite diverse groups of people as well as bonding the already-existing society through smart projects. For example, Fawry is a pioneering financial mobile application that invites users and businesses in over 105,000 locations. The electronic payment includes phone subscription, landline, utility bills, donation, and even car license renewal. They were founded in 2008 and now operate to reach 80,000 service points all across Egypt. Their business portfolio includes Vodafone, Etisalat, Lynks, and many more. Fawry induced a small revolution: over 20 million people use this app to pay their monthly bills. Another Fintech company, XPay combines university fee, club membership, and sports training fee into a single app. Its emphasis lies on community values; family providers lose around 27 business days a year to carry out their payments, children do not have to fear about losing cash, and members overseas no longer have to pay a few-year worth of fees at once when they return. The sense of convenience and modernisation produced from such companies not only impressed the citizens, but also comforted newcomers to the country who may have struggled due to langue, cultural, or other differences. Additionally, Egypt’s tourism sector contributes to sheer 12% of total economy and the implementation of such apps may attract even more tourists, increasing the net export. Payment for transportation, food, house service, and telecommunications will be covered by simply putting in the credit card details through the apps.
According to the World Bank, Egypt is not as much of an efficient country as the more economically developed countries. The amount of energy Egypt needs to produce a measure of GDP is much higher than all the countries in the middle east7. The intensive use of energy can be supported by their choice of rapid industrialisation. Considering the amount of energy consumption, the Energy Ministry launched a programme to replace pre-existing lamp posts with LED lamps that would theoretically save $204.5 million. Total production of oil is 680,000 barrels per day, it contributes 0.72% of the global oil production, and there are 3.9 billion barrels that exist in known oil reserves. Domestic consumption hits 41%, and imports and exports are 80,000 and 189,000 barrels a day, respectively. Some of the export destinations are the EU, India, and China with EU being the most popular destination. Total production of natural gas is 50.86 billion cubic meters, it contributes 1.7% of the global gas production, and there are 1.8 billion cubic meter worth of gas in known gas reserves. Domestic consumption hits 53%, and imports and exports are 7.08 and 212.4 billion cubic meters, respectively. Similarly to oil, some of the top destinations for gas export are the EU, India, and China. These data were obtained from 2013—2015 since newer reports seem to give vague values. Furthermore, electricity production as a total comes to 183.5 billion kWh and 1,864.39 kWh per capita (annually). Electricity consumption is at 159.7 billion kWh and 1,622.58 kWh in total and per capita, respectively. Total import of electricity is 54 million kWh and import per capita is 0.55 kWh. Total export is 1.16 billion kWh and export per capita is 11.77 kWh.
The Solar tree is a combination of engineering and artistic efforts to harvest solar energy efficiently and utilise the solar cell technology8. This project was initiated in 2016 by students from Cairo University with the aim of reducing the energy consumption while advocating the aesthetic façade of innovative technology. The project focuses on solar panels that comes with an electronic tracking device to get the maximum peak power out of the PV solar panels. The energy harvested from these panels successfully powered portable devices such as mobile phones and laptops. The design symbolises a tree, which visually promotes eco-innovative lifestyle.
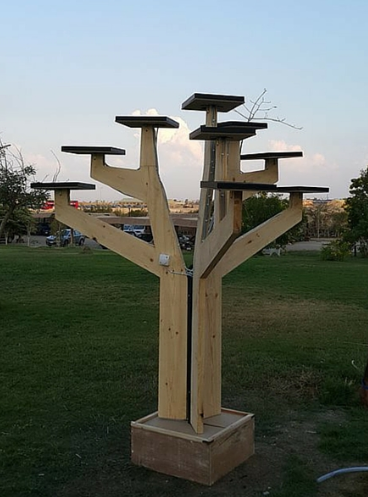
Figure 1 – Solar trees constructed by Hesham et al.9
Egypt possesses a plethora of land with sunny weather and consistent wind, which makes it an optimal region for renewable energy sources including Solar trees mentioned above and wind energy. The renewable market is growing and has potential to be worth billions of dollars. Around 20% of the total electricity produced in Egypt is generated from renewable sources and this is aimed to be increased to over 40% by 2035 with solar energy being the most utilised out of them.
The Gulf of Suez is located on the north-west of the Red Sea and provides an outstanding average wind speed of 10.5 m/s. It is located very close to Cairo as well, making it more cost efficient to construct grid networks leading to the capital. There is a total capacity of 1.2 GW of wind power that is currently established, a 540 MW project that is being built, and another 580 MW project that is being funded. The West Nile is also being investigated to make way for another wind farm. An area of about 7,845 square km was allocated in the Gulf and Nile combined. The Ras Ghareb project is reaching its final stage of construction and is expected to produce 262.5 MW of electricity, providing energy to 500,000 households.
The genetic algorithm is a method to solve both constrained and unconstrained optimisation problems. The solutions are high-quality. This algorithm is commonly used in wind farms to optimise the wind farm layout, but the conditions for this algorithm to be successful may be too simplistic. Chen et al.10 explain that adapting multi-objective genetic algorithm improves the accuracy and practicableness. The reason for using the genetic algorithm out of the available intelligent algorithms in the first place is that the chromosomal string of the genetic algorithm is a binary string10. There are other encodings that are possible, but binary is preferable as it is not as complex. Multi-objective genetic algorithm reduces computational time that can usually be very long for a standard binary string. This is done by using a mixed discrete real integer string as it not only contains the position coordinates of each turbine, but also provides the information regarding the turbines such as the height and type.
Egypt receives between 2,000 – 3,000 kWh per square m of direct solar radiation per year and is shined for 9 – 11 hours a day. A photovoltaic power station called Benban Solar Park is the largest solar park in the world and is located near Aswan, producing around 1.6 GW of electricity when it fully operates. The area covered for this project is 37.2 square km. Power plants in Egypt are funded by various companies/organisations such as the Global Environmental Facility (GEF), the Japan Bank, the European Bank for Reconstruction and Development (EBRD), and the International Finance Corporation (IFC). The previous biggest solar power installation was the 10 MW Siwa Solar PV Plant, producing around 17.5 GWh per year.
Solar panel technology has been advancing just like many other types of technology. Popular types of solar technology are photovoltaic and concentrated solar power (CSP). Photovoltaic panels are usually more commercially developed and are used for both small and large scale applications while CSP technology yields higher economic returns despite being expensive and is suited for large scale applications11. CSP tends to generate more power than PV panels, hence why it explains higher economic returns. However, the initial installation costs much more. In the case of Egypt, CSP would be worth the investment as there is a reliable source of sunlight all year long on top of all the landmass. Regardless of the choices between the two, with the market price for solar energy (renewable energy in general) getting cheaper year by year, it is a necessary and effective form of sustainable energy. Figure 2 shows investment cost assumptions for both PV and CSP technologies. The costs may vary depending on government laws and policies.
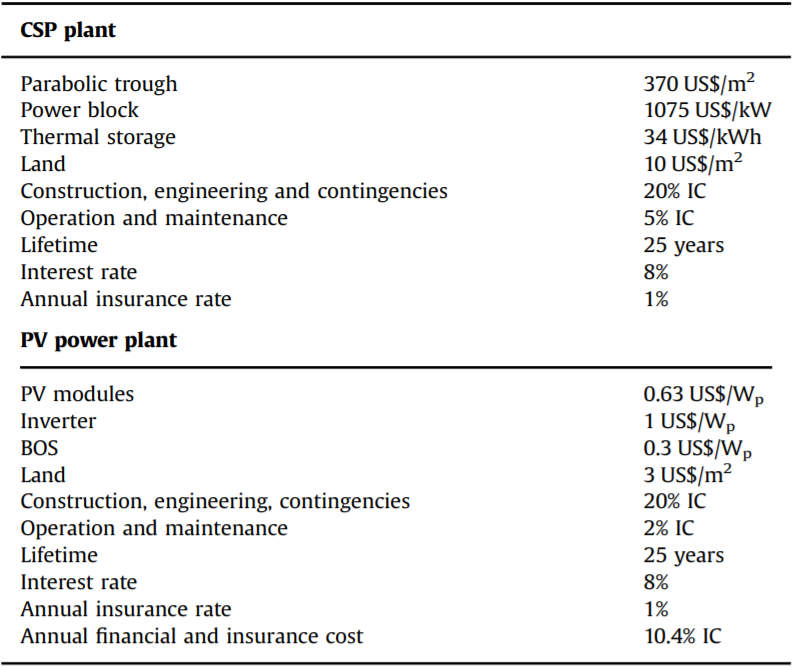
Figure 2 – Investment cost assumption for CSP and PV plant11.
Reference
1 https://www.worldometers.info/world-population/egypt-population/
2 Cia.gov. (2019). Africa :: Egypt — The World Factbook – Central Intelligence Agency. [online] Available at: https://www.cia.gov/library/publications/the-world-factbook/geos/eg.html
3 Kinuthia, S. (2019). Major Ethnic Groups in Egypt. [online] WorldAtlas. Available at: https://www.worldatlas.com/articles/what-is-the-ethnic-composition-of-egypt.html
4 https://www.dw.com/en/egypt-the-amazing-forest-in-the-desert/av-17233507
5 https://www.statista.com/topics/2510/egypt/
6 https://tradingeconomics.com/egypt/indicators
8 https://www.worlddata.info/africa/egypt/energy-consumption.php
9 https://egyptinnovate.com/en/success-stories/solar-tree-harvesting-energy
10 Chen, Y., Li, H., He, B., Wang, P. and Jin, K. (2015). Multi-objective genetic algorithm based innovative wind farm layout optimization method. Energy Conversion and Management, 105, pp.1318-1327.
11 Khan, J. and Arsalan, M. (2016). Solar power technologies for sustainable electricity generation – A review. Renewable and Sustainable Energy Reviews, 55, pp.414-425.
Recent Comments